
Hydroelectric Power
Where I live in Eastern Canada, hydroelectric power is so dominant that people refer to household electricity bills as a “hydro bill”, regardless of the actual local power source. By contrast, in the modern renewable energy landscape it is easily overlooked, with most of the focus on solar, wind, and batteries. It is easy to forget the fact that hydroelectric power is still by far the most dominant source of carbon-free power in the world, generating 4,435 TWh of clean electricity in 2025, 14% of the world total (Ember). The world’s installed fleet sits at roughly 1,253 GW of conventional capacity plus another 189 GW of pumped storage (2025 World Hydropower Outlook). Hydro is also one of the oldest forms of large-scale electricity generation. Niagara Falls had a working hydro plant in 1895, and many of today’s largest hydro plants were built between the 1930s and the 1970s. Despite its long history, hydropower is still doing the heavy lifting on most of the world’s cleanest electricity grids.
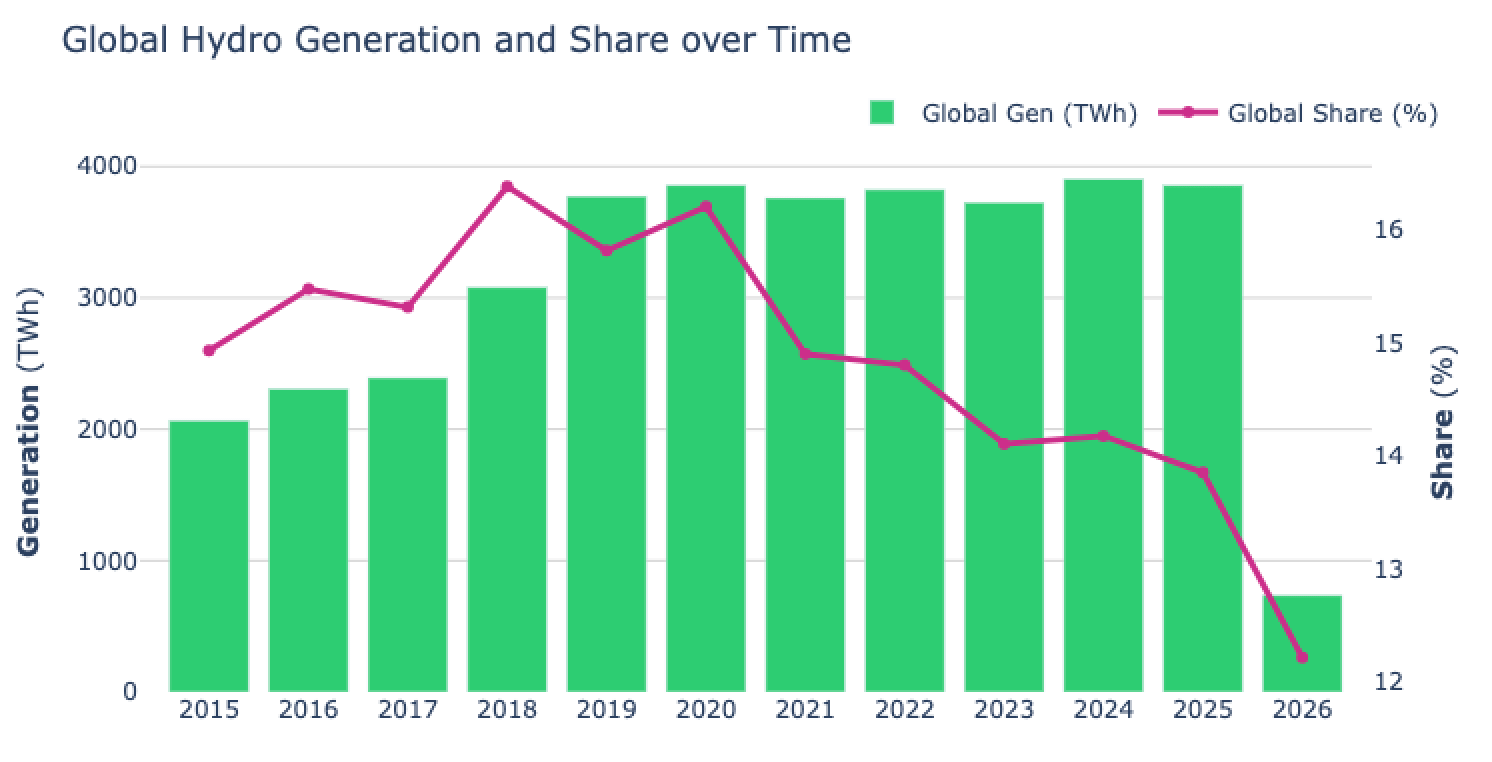
Source: Ember, via energystats.org. 2026 should be ignored here because it is only a partial year of data.
These headlines obscure a steady shift. In 2024, solar and wind combined (~15%) surpassed hydropower for the first time. At current growth rates, both solar and wind power will individually surpass hydro over the next decade or so. Hydro’s share of global generation is no longer growing meaningfully, yet it remains the backbone of clean electricity in dozens of countries, from Norway and Brazil to Canada, Paraguay, and parts of Africa. Hydro is the forgotten giant of the clean energy transition: mature, undramatic, and increasingly strategic rather than focused on pure capacity. Its real value over the next two decades will come from flexibility to firm up variable renewables and from modernization of an aging fleet, more than from new greenfield mega-projects. This article walks through how hydropower works, why hydro pairs so well with wind and solar at multiple timescales, the global growth outlook, the modernization opportunity, and some of the risks and downsides to keep in mind.
How Hydropower Works
Hydropower converts the kinetic and potential energy of moving water into mechanical energy via a turbine, then into electricity via a generator. The “fuel” is the gravitational pull on water that the sun continuously lifts back into the atmosphere through evaporation, making the cycle 100% renewable. The simple physics is captured by Power ≈ ρ × g × Q × H × η. , where ρ is the density of water (1,000 kg/m³), g is gravitational acceleration (9.81 m/s²), Q is volumetric flow rate (m³/s), H is head (vertical drop, in m), and η is overall efficiency. Since ρ and g are constants, the design levers are Q, H, and η. Engineers therefore tend to build plants around two very different regimes: lots of head with little flow (mountain plants), or lots of flow with little head (river plants).
Each regime is matched by a different turbine family. Pelton turbines suit high head and low flow, typical of alpine plants. Francis turbines, by far the most common, handle medium head and medium flow and are used in famous plants such as Hoover, Three Gorges, and Itaipu. Kaplan turbines are designed for low head and high flow, well suited to slow-flowing rivers.
Unlike a solar panel’s nameplate rating, a hydro plant’s nameplate capacity can be a reasonable indicator of real output, although this varies with season and a plant’s particular role in the grid. As with other energy plants, the capacity factory is the ratio between actual annual output and theoretical maximum output. Capacity factors typically run 30–60% for reservoir plants and 40–70% for run-of-river plants, but they vary enormously with hydrology and dispatch role. Hydro plants with reservoirs are often intentionally turned down when variable power sources such as solar and wind are available, which reduces their capacity factor.
Dammed Reservoir Plants vs. Run-of-River
There are two fundamentally different ways to harvest moving water. A reservoir or dammed hydro plant impounds water behind a dam, decoupling generation from instantaneous river flow. Output can be ramped up or down on command, often within seconds, and shifted across hours, days, or even seasons. Reservoir hydro is, in the language of grid operators, dispatchable. A run-of-river plant has little or no impoundment; output rises and falls with the river itself. It is cheaper to build and far less ecologically invasive, but its generation is non-dispatchable and varies daily and seasonally.
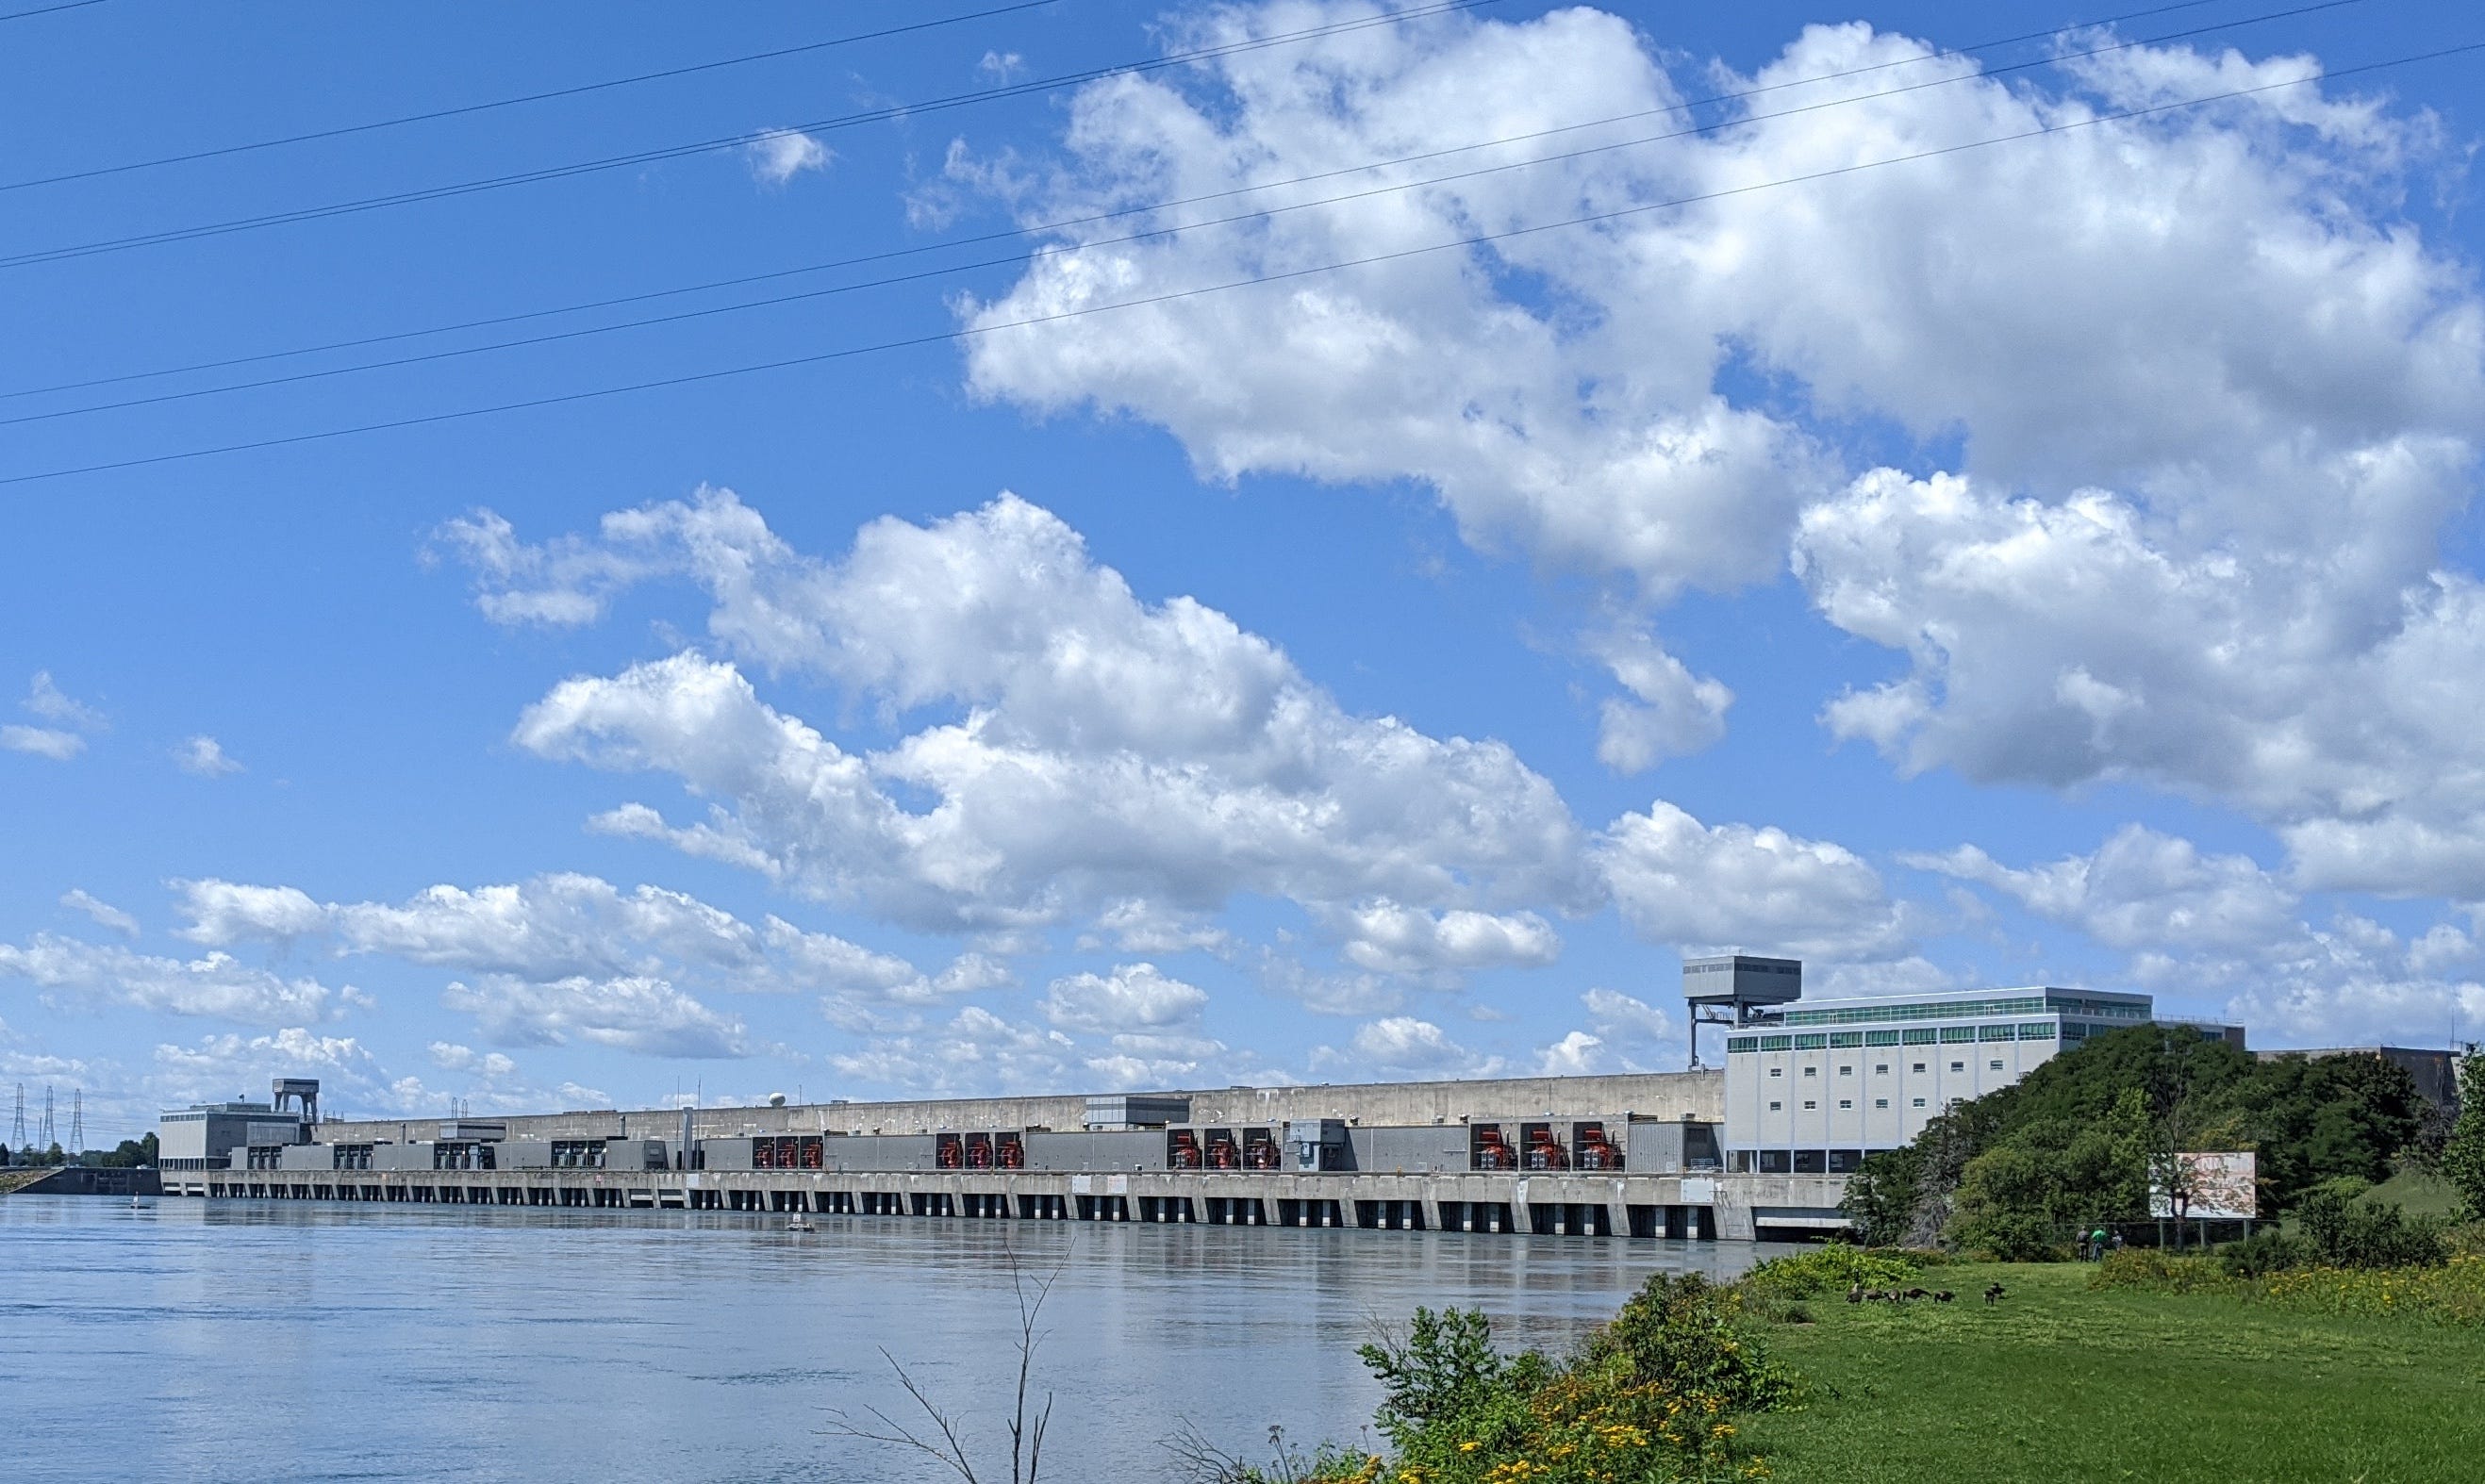
The 1 GW Saunders Generating station in Ontario is an example of a reservoir hydro project.
How the global fleet splits between these categories is fuzzier than you might expect. The total of ~1,253 GW conventional plus ~189 GW pumped storage gets us to roughly 1,442 GW worldwide (IHA), but there is no clean global number for pure reservoir vs. run-of-river breakdown, and many “reservoir” plants only have a few hours of storage. As a reference data point, for new additions through 2030, the IEA expects a roughly 50/30/20 split between reservoir, pumped storage, and run-of-river projects (IEA Hydropower Special Market Report).
The trade-off to keep in mind is that reservoirs deliver dispatchability and seasonal storage but with higher financial, ecological, and social cost. Run-of-river is far less invasive and expensive, but with much less flexibility. These are not competing categories so much as different tools, and the modern grid needs some of each.
A Natural Complement to Wind and Solar
The future role for hydro power is less about capacity, and more about how it complements other parts of the low-carbon grid. Solar and wind are now the cheapest sources of new electricity, but they are non-dispatchable: they generate when the weather allows, not when the grid needs them. Reservoir hydro is one of the very few large-scale, low-carbon resources that can fill those gaps today, and it does so at multiple timescales at once. Hydro’s flat or declining share of total generation is offset by its rising value at the margins.
On a daily and sub-daily timescale, reservoir hydro is highly dispatchable. Many plants can ramp from zero to full output in minutes (some in seconds), restart smoothly without thermal stress, and shape their output through the day to track residual demand. Hydropower today accounts for roughly 30% of the world’s installed flexible electricity supply capacity (IEA Hydropower Special Market Report). This is exactly the profile needed to fill in for solar’s daily cycle and wind’s hour-to-hour variability. For example, the Bonneville Power Administration uses Columbia River dams to balance regional wind in the US Pacific Northwest, ramping hydro down when the wind blows and back up when it dies. California regularly imports that same Pacific Northwest hydro flexibility to cover the steep evening solar ramp on its grid. Norway and Sweden absorb surplus wind energy overnight (often by simply not generating) and export flexibility to Germany, the UK, and the Netherlands via HVDC links such as NordLink and North Sea Link (SINTEF / NTNU).
Across the year, hydro and solar tend to be anti-correlated. Rainy seasons increase river flow and reservoir levels but depress solar output through cloud cover; dry seasons drain reservoirs but maximize solar irradiance. Even run-of-river plants therefore pair surprisingly well with solar across seasons. In temperate climates such as much of Europe and North America, the rainy season falls in winter, allowing reservoirs to refill and provide bridging power until the peak solar months in summer (Brazilian and Portuguese studies confirm the pattern in their respective regions). The pattern is not universal - in some monsoon-driven climates, the rainy season can be both cloudy and hot - but as a regional-scale generalization, it holds across most of the world’s grids. Here is what this correlation looks like in Portugal for example:
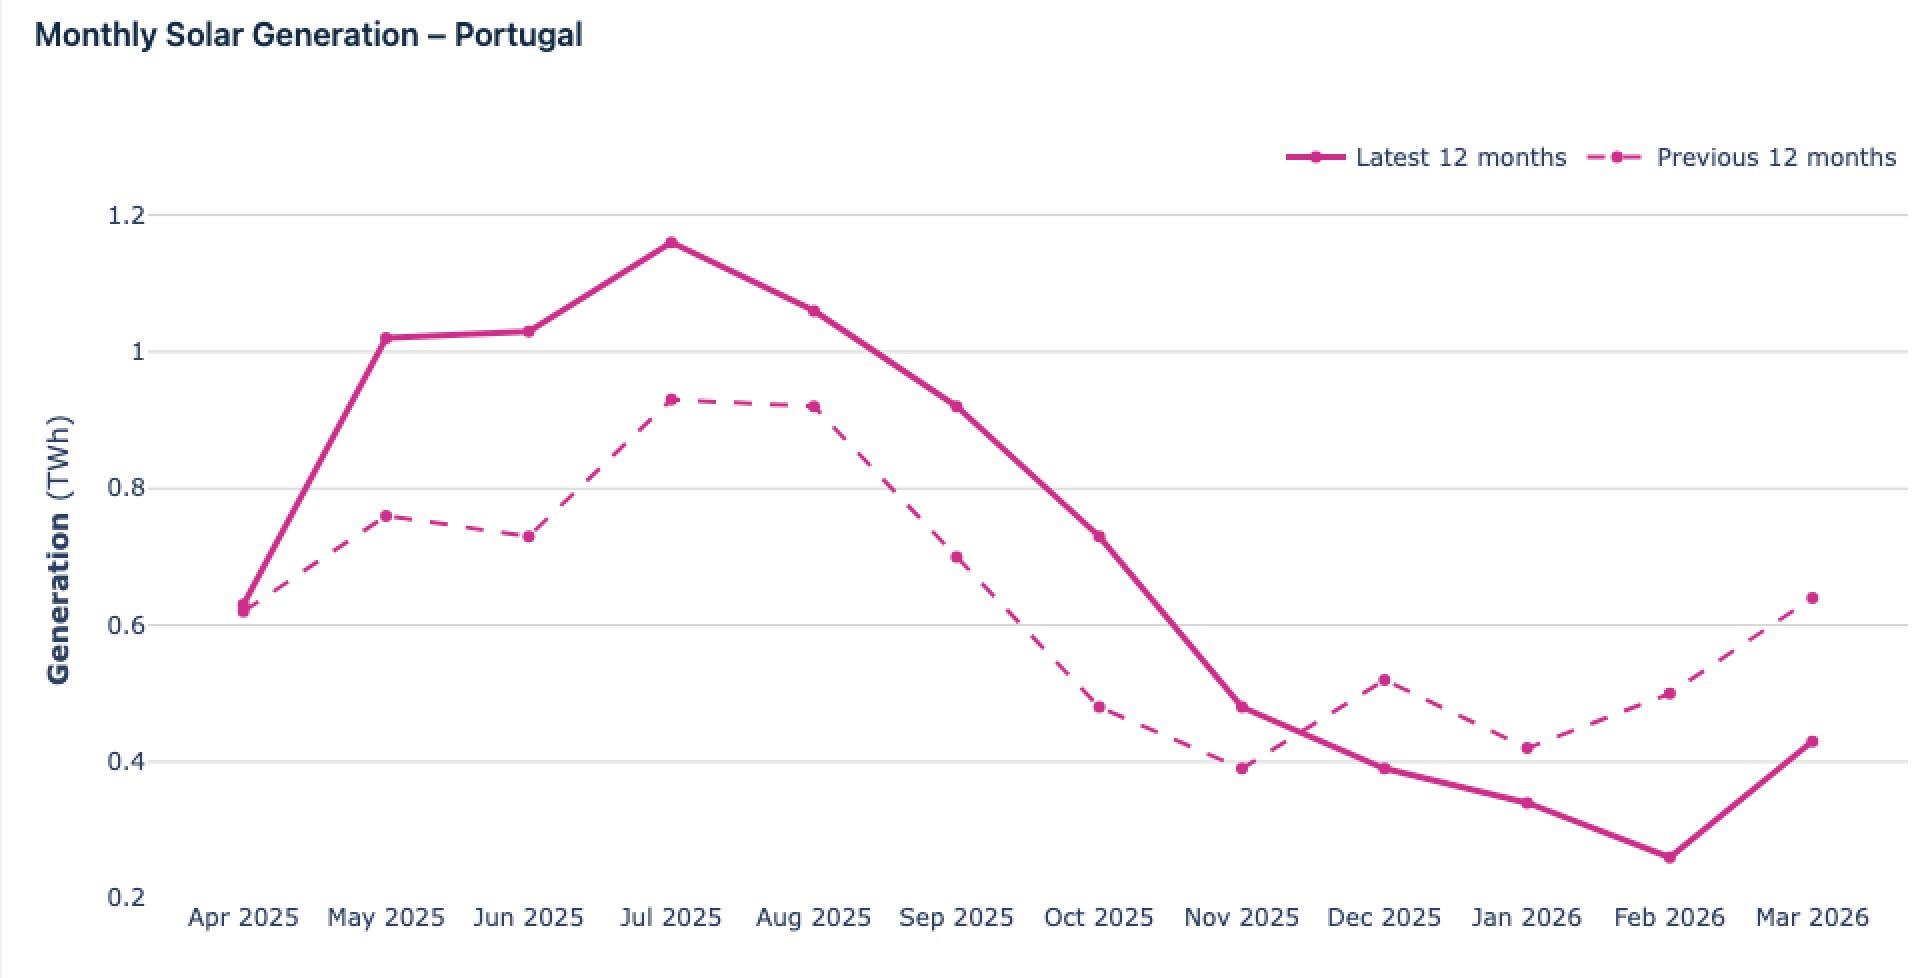
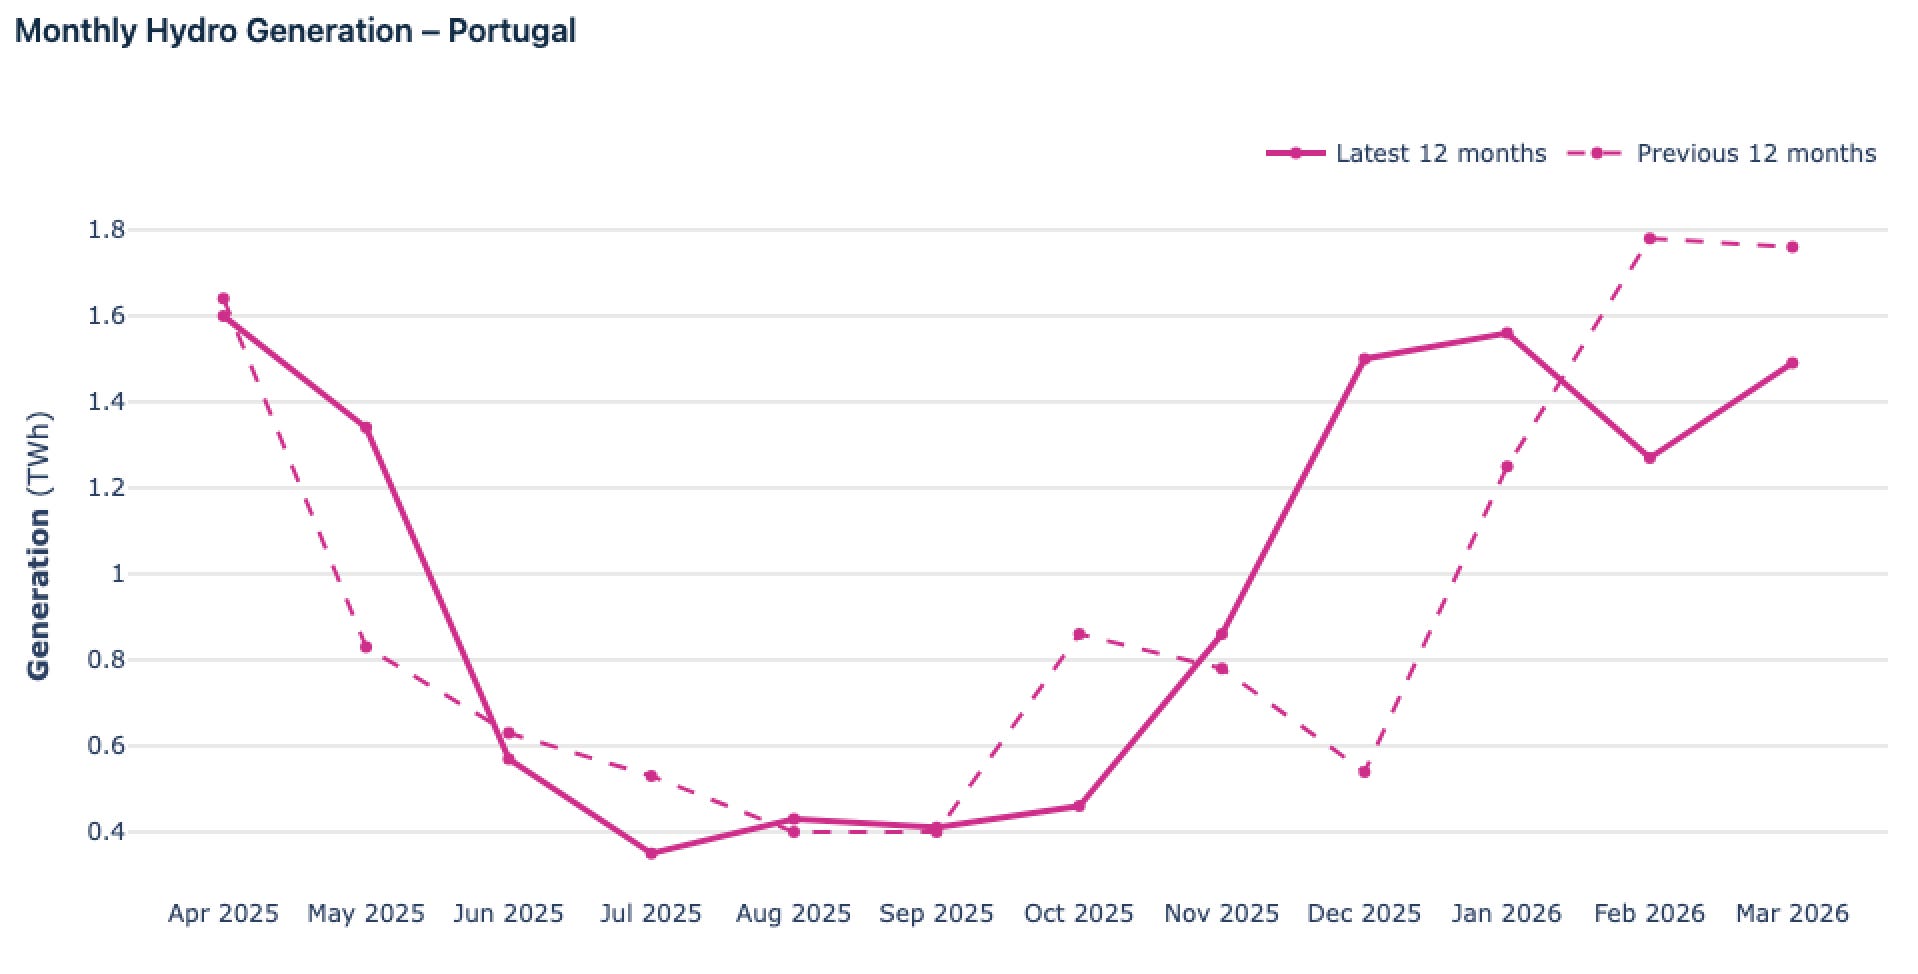
In Portugal we see summer-peaking solar balancing nicely with winter-peaking hydro. Source: Ember, charts from energystats.org.
The strategic punchline is that as wind and solar penetration grows past roughly 50% of generation, the system needs more flexibility, not less, and the marginal value of dispatchable, low-carbon energy rises sharply. Hydro’s role is therefore shifting from primarily an energy source to primarily a flexibility provider, integrating variable renewables across timescales from seconds to seasons (IRENA). That advantage depends on geography though. Regions without significant reservoir hydro, including the UK, much of the US Midwest, and most of Australia, will need other flexibility tools, including batteries, demand response, transmission to hydro-rich neighbours, and longer-duration storage technologies.
Global Generation and Growth Outlook
The recent picture is one of plateau. Hydro generation declined in 2023 as drought hit China and Europe, then rebounded about 10% in 2024 to ~4,578 TWh. Around the same time, solar PV passed hydropower in installed capacity, and on a generation basis, solar and wind combined surpassed hydro for the first time (IEA, Ember).
The forward-looking projections from major organizations broadly agree on the direction, but not the pace. Under current policies, the IEA expects global hydro capacity to grow about 17% (~230 GW) between 2021 and 2030 — but net additions over this decade are roughly 23% lower than the previous decade. To stay on a Net Zero Emissions trajectory, the IEA estimates the world would need around 40 GW per year of new hydro capacity through 2030, roughly double the recent pace (IEA Hydropower Special Market Report). IRENA’s 1.5°C scenario is more aggressive, calling for hydro (including pumped storage) to roughly double to 2,500–3,000 GW by 2050, with capacity excluding pumped storage reaching ~1,500 GW by 2030 (IRENA). The US EIA, like the IEA, treats hydro as a slow-growing, geographically concentrated resource whose long-term share gradually declines as solar and wind expand far faster.
Why is hydro growing so slowly? The best greenfield sites in OECD countries are already developed, so most of the remaining growth pipeline sits in China, India, Africa, and parts of Southeast Asia. Hydro projects also have long lead times (7–15 years), high capital intensity, and significant risk of cost-overruns. Environmental, permitting, and community opposition has tightened in nearly all developed markets. The slow-growth story should not be read as obsolescence, though. The value of a fleet doesn’t only depend on its size, but on how it is used. Hydro’s marginal value is shifting from energy supply to flexibility services, which is exactly why the modernization story is more interesting than the headline numbers suggest.
Modernization and Repowering
The world’s hydro fleet is old. In the US, the average plant is over 60 years old, and many large plants were commissioned between the 1930s and the 1960s. Most of these assets can be modernized in place, often quietly delivering meaningful capacity and efficiency gains without building new dams.
Modernization comes in several flavours. New Francis turbines commonly exceed 95% hydraulic efficiency, compared with 85–90% for early 20th century designs. Modern power electronics allow rotor speed to be decoupled from grid frequency through variable-speed operation. This allows a turbine to maintain peak efficiency across a wider range of head and flow conditions, unlocking up to ~10% efficiency gains (MDPI, 2019). Permanent-magnet generators and modern excitation systems improve electrical efficiency and cut maintenance. And fish-friendly designs such as Voith’s Minimum Gap Runner can reach hydraulic efficiencies of around 93–94% with fish survival rates above 98%, which is important for relicensing in environmentally sensitive watersheds.
A representative example: Alcoa’s Tapoco / Cheoah plant in North Carolina replaced four ~90-year-old Francis turbines with high-efficiency stainless-steel units, adding about 95,000 MWh/yr of generation (NHA case study). Similar projects are running elsewhere: Ontario’s century-old Kakabeka Falls station is being refurbished with new Francis turbines that lift peak capacity by 12% to 27 MW (OPG), and Norway’s 85-year-old Svean plant is being upgraded from 27 MW to 36 MW (Nordic Investment Bank).
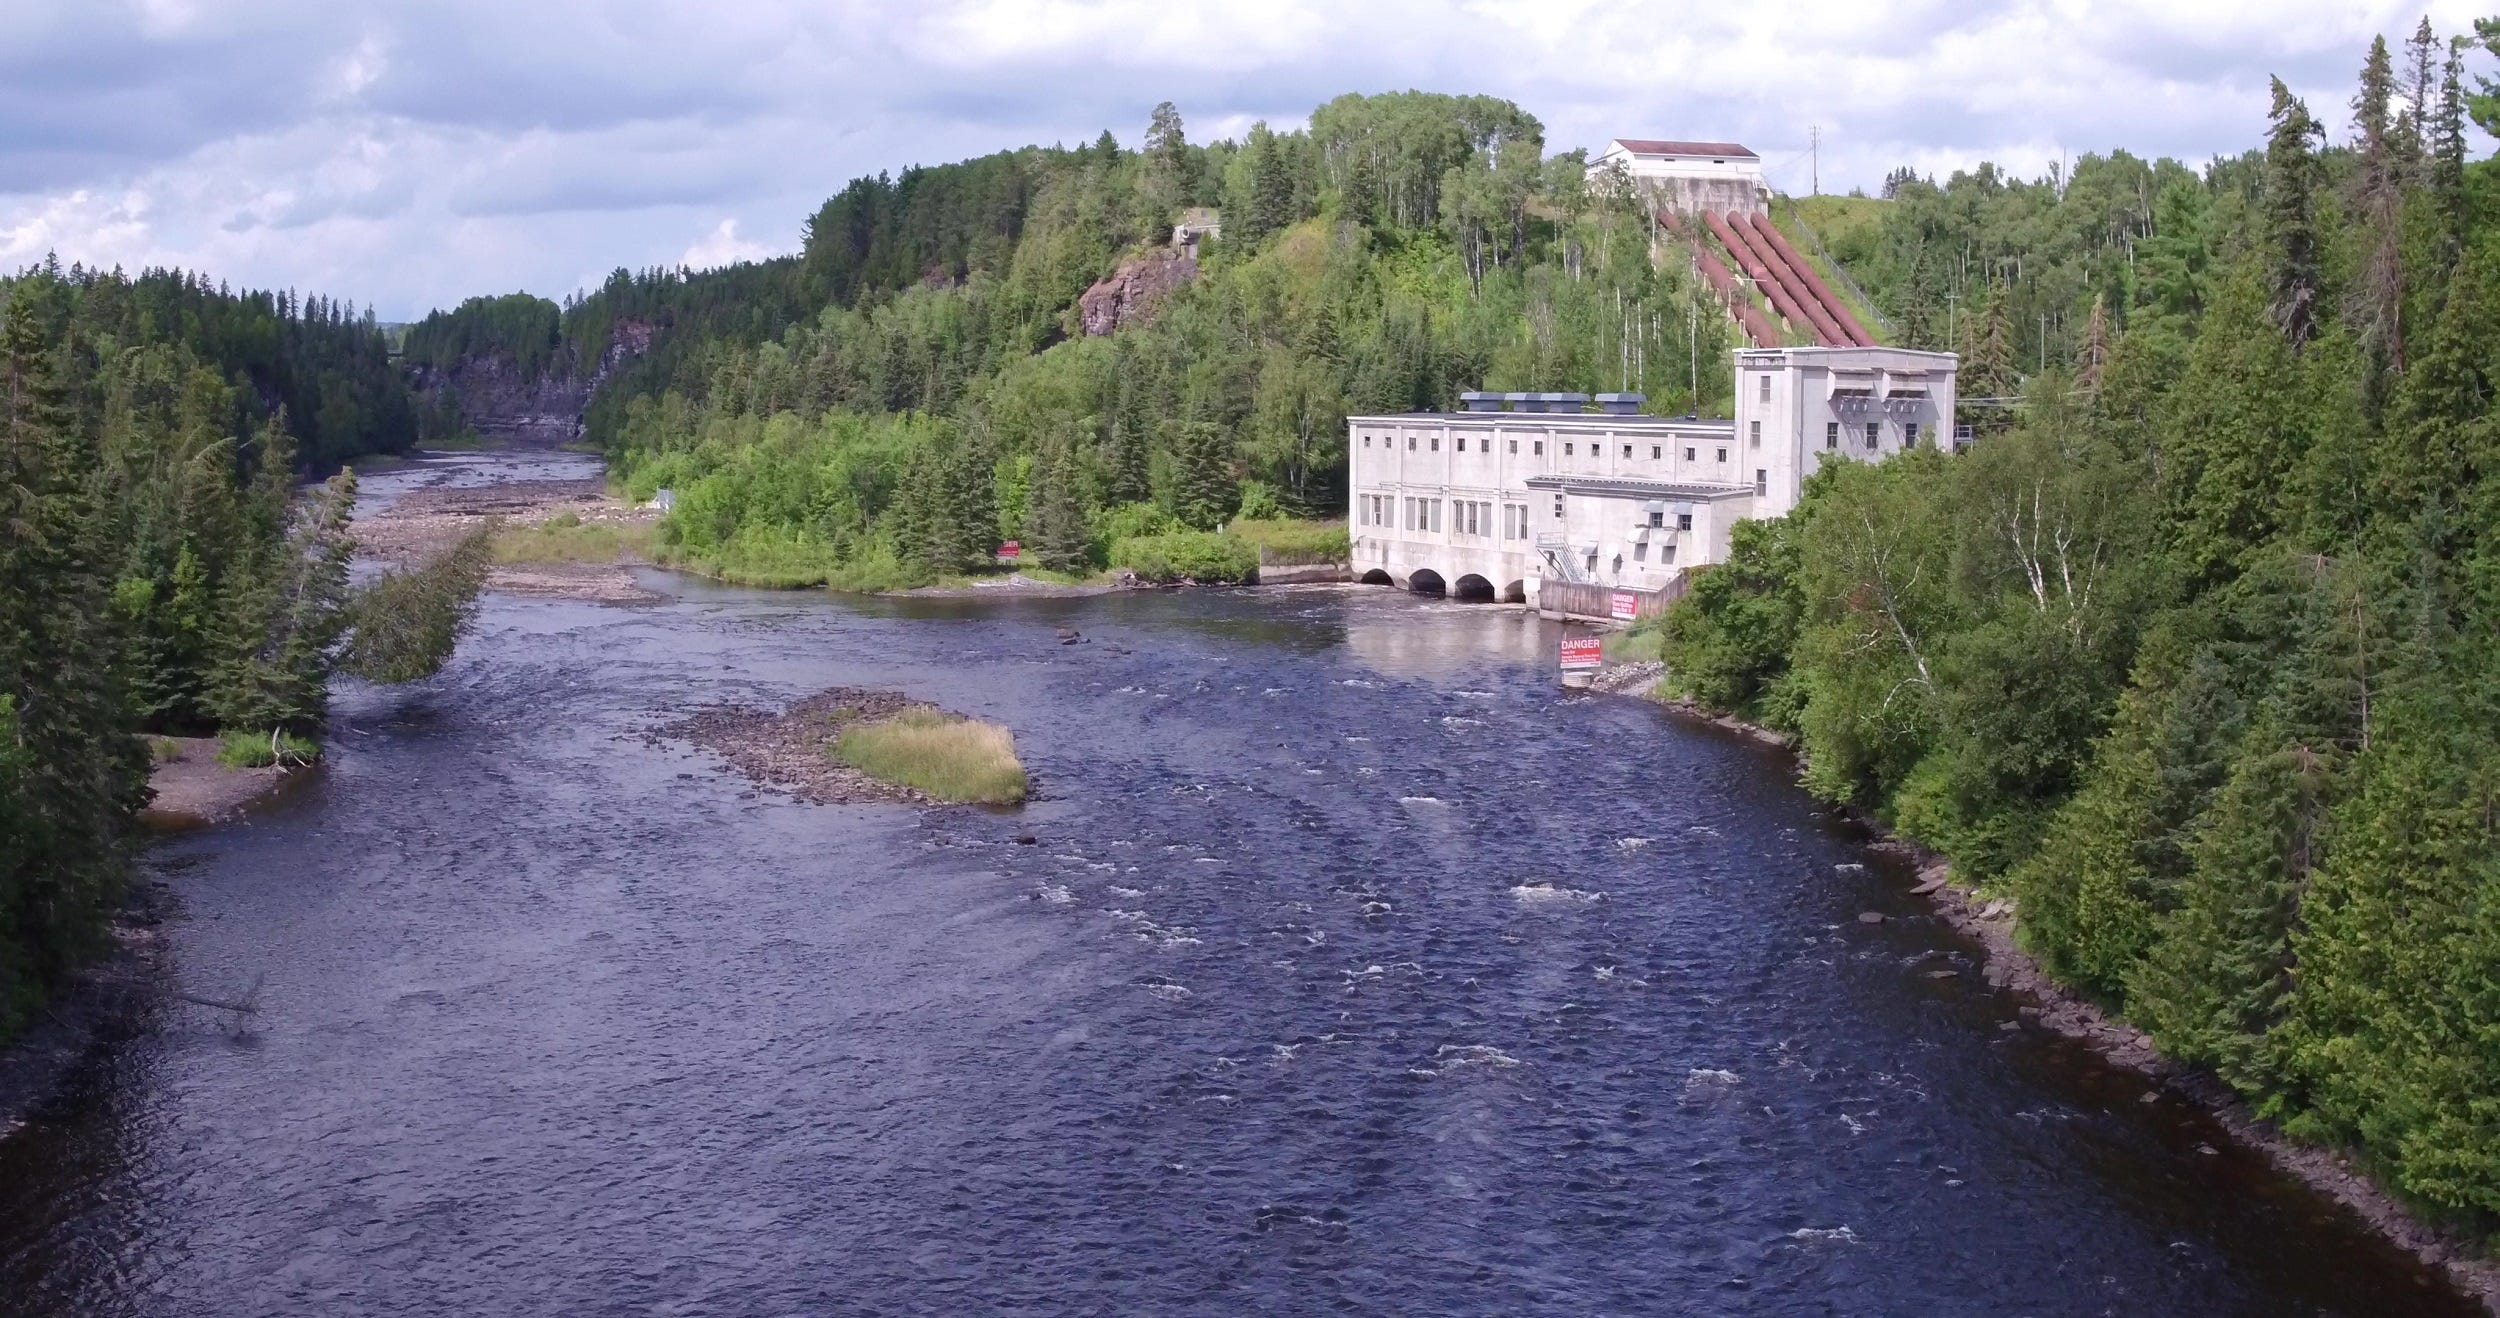
The Kakabeka Falls generating station, operating since 1906 (Image source: OPG)
Two statistics from the US give a sense of the potential for modernization. About 9 GW of additional capacity is achievable purely through modernization of existing plants (Navigant Consulting, cited by NHA). And fewer than 3% of the US’s roughly 90,000 dams currently generate any electricity at all. Retrofitting non-powered dams with turbines is one of the cheapest ways to add carbon-free capacity, since the most expensive piece (the dam) already exists (DOE). Worldwide, the IEA expects that modernization will account for 45% of all capacity additions over the next five years (Hydropower Special Market Report). Greenfield hydro growth may be slow, but the installed fleet still has plenty of upside through re-powering, non-powered-dam retrofits, and relicensing-driven upgrades. The story here is not new mega-projects but a quieter incremental upgrade cycle.
Limitations and Risks
It would be dishonest to discuss hydro without flagging its very real flaws. Hydro generation depends on hydrology, which depends on weather and climate. The 2023 drought in China and Europe knocked global hydro generation down measurably and forced extra coal use; 2024 only rebounded because the rains returned. With increasing climate variability, hydro is becoming less firm in some regions, not more. Warmer winters are also altering the seasonal pattern of snowmelt and runoff — earlier flow in spring, but less in late summer. Overall, a warming globe will dramatically increase rain in some regions while reducing it in others, creating winners and losers for hydro power (this overview from ESRI provides a good picture of current predictions).
The ecological costs of dam construction are well established: river fragmentation, blocked fish migrations, altered sediment transport, and (in some cases) methane emissions from decomposing flooded biomass. The social costs can be substantial, such as the Three Gorges project that displaced 1.3 million people, and many large African and South Asian projects have similar histories. Most of the world’s unbuilt economic potential sits in Asia, Africa, and South America, regions where regulations and capital markets are still maturing. Hydro is also a prototypical mega-project class, with a long track record of cost overruns and slipped schedules. Even existing reservoirs lose effective storage capacity over decades as sediment accumulates, a problem that modernization rarely addresses.
Summing up
Hydropower is mature, massive, and quietly indispensable. It generates more clean electricity than any other low-carbon source today, and it sits at the heart of many of the world’s cleanest electricity grids. The growth story has shifted: the next decade will see far more solar and wind capacity built than hydro, and that’s fine - they are complementary technologies, not competitors.
Hydro’s strategic role in the energy transition is now less about new bulk supply and more about three other things. First, modernization of the existing fleet: efficiency upgrades, capacity additions, and powering up the world’s many non-powered dams. Second, flexibility for variable renewables. Reservoir hydro is a natural multi-timescale partner to cheap but intermittent solar and wind. Third, dispatchable backbone capacity that allows variable renewables to be deployed more aggressively than they otherwise could be.
While major new construction comes with significant risks, there are many benefits to maintaining and optimizing existing hydro infrastructure. Solar, wind, and batteries will represent much of the net new growth, but hydroelectric power will continue to play an important role in modern electric grids.
Resources
Hydropower Special Market Report - Detailed overview of the current hydro market, and forecasts to 2030 from the IEA.
Hydropower (system page) - IEA’s landing page on hydro power. Good high level survey of the landscape and links to detailed statistics.
The Changing Role of Hydropower (2023) - A detailed big picture report from the International Renewable Energy Association (IRENA). This report argues for significant global growth in hydroelectric capacity, but spells out some of the major risks involved.
2025 World Hydropower Outlook - Annual snapshot of global generation, capacity, and future growth pipeline. This is put out by the International Hydropower Association, which is an industry trade group, so it paints a rosy picture, but is still a reliable source of statistics.
Renewables 2025 Global Status Report (Hydropower section) - This is a good and relatively short summary of the global state of hydropower. Published by REN21, which is an NGO backed by a distinguished group of members (national governments, scientific institutions, and other major global NGOs).
U.S. Hydropower Market Report (2025 ed.) - Detailed breakdown of current US hydro fleet, and development pipeline.
Modernizing Hydropower - Concrete repowering case studies in the US, from their national trade association.
Integrating Solar and Wind (2024) - Framework for variable-renewable integration and the role of dispatchable resources. Although it is not mentioned in the title, the report also talks about the role of hydro power as a flexibility resource.
Norway as a Flexibility Provider in a Renewable Europe - Gives a detailed overview of how hydro power from Norway provides critical short and long-term balancing for wind and solar power in Northern Europe.